Your website’s bleeding visitors faster than a punctured tire loses air. Here’s the harsh truth: website performance monitoring isn’t just a nice-to-have—it’s your digital lifeline. One slow page load, one brief downtime, and your potential customers are already three clicks deep into your competitor’s site.
I’ve watched million-dollar campaigns crumble because someone ignored the warning signs. The brands that thrive? They obsess over performance data like day traders watch stock tickers.
1. Why Website Performance Monitoring Matters More Than Ever
The digital landscape got brutal. Users expect sub-second responses, seamless mobile experiences, and zero tolerance for downtime. Google’s Core Web Vitals continue dominating search rankings, while conversion rates tank harder than crypto in a bear market when performance lags.
Your website isn’t just a digital brochure—it’s your revenue engine. And engines need constant monitoring.
2. Essential Performance Metrics You Can’t Ignore
Site Uptime:
Website uptime measures how long your site stays accessible to users. Think of it as your digital pulse—when it flatlines, so does your business.
The Gold Standard:
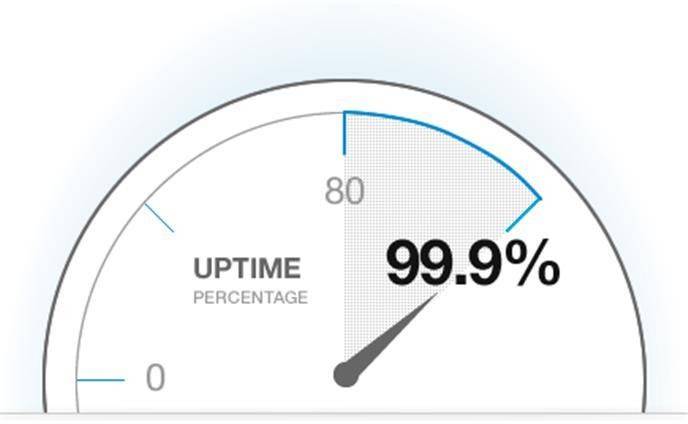
- 99.99% uptime = 5.25 minutes downtime yearly
- Industry benchmark: 99.999% (five nines)
- Calculate: Uptime ÷ Total time = Availability percentage
I’ve seen e-commerce sites lose $40,000 in revenue during a 20-minute outage. That’s why monitoring server performance immediately when issues arise isn’t optional—it’s survival.
Page Load Speed:
Loading time determines whether visitors stay or bounce. Anything over 2 seconds feels like digital molasses.
Performance Benchmarks:
- Optimal load time: Under 2 seconds
- Acceptable: 2-3 seconds
- Death zone: 3+ seconds (expect 11% fewer page views per extra second)
Critical Factors Affecting Speed:
- Image optimization and compression
- Server response times
- Third-party scripts and plugins
- Content Delivery Network (CDN) usage
- Browser caching strategies
Time to First Byte (TTFB): Server Performance Indicator
TTFB measures how quickly your server starts delivering content. It’s like measuring the reaction time of your website’s brain.
Optimal TTFB Ranges:
- Excellent: Under 200ms
- Good: 200-500ms
- Needs improvement: 500ms+
Core Web Vitals:
These metrics directly impact your search rankings:
| Metric | Good | Needs Improvement | Poor |
|---|---|---|---|
| Largest Contentful Paint (LCP) | ≤2.5s | 2.5-4.0s | >4.0s |
| First Input Delay (FID) | ≤100ms | 100-300ms | >300ms |
| Cumulative Layout Shift (CLS) | ≤0.1 | 0.1-0.25 | >0.25 |
3. Advanced Monitoring Strategies
Real User Monitoring (RUM):
RUM collects performance data from actual visitors browsing your site. Think of it as having thousands of quality assurance testers working 24/7, except they’re your real customers.
RUM Deep Dive Benefits:
- Geographic insights: Discover if users in Asia experience slower loads than those in North America
- Device-specific patterns: Identify performance gaps between iPhone 15 Pro users and Android budget phones
- Network condition impact: See how 5G vs. 3G affects your conversion funnels
- User journey mapping: Track performance degradation as users navigate deeper into your site

I’ve seen RUM data reveal that a client’s checkout process was 40% slower on Samsung devices due to a specific JavaScript library conflict. That insight alone boosted mobile conversions by 23%.
Synthetic Monitoring:
Synthetic monitoring runs automated tests from various locations using simulated user interactions. It’s like having a robot army constantly stress-testing your site before real users arrive.
Advanced Synthetic Strategies:
- Multi-location testing: Monitor from 10+ global locations to catch regional CDN issues
- Device emulation: Test across 50+ device/browser combinations automatically
- Transaction monitoring: Simulate complete user journeys (login → browse → purchase)
- API endpoint monitoring: Track backend service performance that affects frontend speed
Pro Tip: Set up synthetic alerts for 5% performance degradation. By the time users notice, you’ve already fixed it.
The Hybrid Approach:
Smart brands run both simultaneously. Synthetic catches the technical issues; RUM reveals the human impact. Here’s how I structure it:
Synthetic for Proactive Defense:
- Hourly checks from 15 global locations
- Alert thresholds at 15% performance drop
- Critical user path monitoring (homepage → product → checkout)
- Competitor benchmarking runs
RUM for Strategic Intelligence:
- Session replay for performance troubleshooting
- Cohort analysis (new vs. returning user performance)
- Revenue correlation with performance metrics
- A/B testing performance impact
Mobile Performance:
Mobile isn’t just smaller screens—it’s entirely different user behavior, network conditions, and performance expectations.
Mobile-First Monitoring Tactics:
- Progressive loading analysis: Track how content renders as users scroll
- Touch interaction latency: Measure tap-to-response times (should be under 100ms)
- Network adaptation monitoring: How your site performs on 3G, 4G, and 5G
- Battery impact tracking: Resource-heavy pages drain batteries and hurt user experience
Mobile Performance Killers:
- Third-party scripts that don’t lazy load
- Unoptimized hero images above the fold
- Complex JavaScript frameworks on mobile CPUs
- Auto-playing videos that eat data plans
Location-Based Performance Intelligence
Your Tokyo users might experience blazing speeds while your São Paulo visitors suffer. Geographic performance monitoring reveals these hidden conversion killers.
Regional Monitoring Strategy:
- CDN performance by continent
- Local server response times
- Third-party service latency variations
- Cultural user behavior impact on performance needs
4. Top Performance Monitoring Tools
Free Tools That Deliver Results
- Google PageSpeed Insights: Core Web Vitals analysis
- GTmetrix: Comprehensive performance reports
- Pingdom: Uptime and speed monitoring
- Google Search Console: Performance insights from Google’s perspective
Premium Solutions for Serious Monitoring
- New Relic: Full-stack observability
- Datadog: Real-time monitoring and analytics
- Dynatrace: AI-powered performance intelligence
- Site24x7: All-in-one website monitoring
5. Building a Performance-First Culture
Performance monitoring isn’t a one-person job. It requires buy-in from development, marketing, and business teams. Create shared dashboards, set performance budgets, and make page speed a key metric in project reviews.
Remember: every team decision impacts performance. That flashy widget might look cool, but if it adds 2 seconds to load time, it’s costing you customers.
The Bottom Line
Website performance monitoring isn’t about perfectionism—it’s about competitive advantage. While your competitors debate which tool to use, you’re already optimizing based on real data.
Start with one metric, master it, then expand. Your future self (and your conversion rates) will thank you.
Ready to turn your website into a performance powerhouse? The data’s waiting—you just need to start listening.