Oracle Service Bus is a module of Oracle Fusion Middleware that enables high-volume SOA environments to use standards-based integration. Oracle SOA Suite includes a feature called Service Bus, which serves as the backbone for SOA messaging. Across an enterprise-wide data network, Service Bus connects, mediates, and handles connections between heterogeneous networks, legacy systems, packaged applications, and numerous enterprise service bus (ESB) instances. This blog describes Oracle Service Bus, Oracle Fusion Middleware, and the various administration activities available by Oracle Enterprise Manager Fusion Middleware Control and the Oracle Service Bus Console. You can get this Oracle service bus training available online which would assist you in upskilling the knowledge on Oracle Platform. The following sections make up this blog which covers the concepts of Oracle Service Bus such as Oracle Fusion Middleware, Runtime Monitoring, Runtime Management, Runtime Security, and Server Monitoring, and Management.
Overview of Oracle Fusion Middleware
Oracle Fusion Middleware is a software set focused on open standards that contains the following technologies and services: business intelligence, Integration services, and collaboration are all covered by Java EE and developer tools.
Oracle Fusion Middleware provides comprehensive program deployment, development, and management support. The Oracle Enterprise Manager Fusion Middleware Control Console is used to track Oracle Fusion Middleware components as they are running.
Overview of Oracle Service Bus
Oracle Fusion Middleware includes Oracle Service Bus, which offers integration of standards for SOA environments consisting of high-volume.
Service Bus is a feature in Oracle SOA Suite that acts as the backbone for SOA messaging. Across an enterprise-wide data network, Service Bus links mediate and handles connections between heterogeneous networks, legacy systems, bundled applications, and numerous instances of enterprise service bus (ESB). The SOA principles of building coarse-grained, standards-based networks, and loosely coupled are followed by Service Bus, as a result, a neutral container is created in which business operations can connect service customers and back-end business facilities without regard to the underlying infrastructure.
Monitoring and Management of Services: An Overview
Tracking, alerting, reporting, setup, and maintenance are also included in the Service Bus runtime software. The Service Bus monitoring system allows you to view server statistics such as the number of messages processed successfully or unsuccessfully, the average message processing execution time, the number of bugs and notifications produced, and the average response time.You will display tracking statistics for the latest aggregation interval, the time since you last reset statistics for this service, or the period since you last reset statistics for all services using Fusion Middleware Control.You can only get data after the last reset using the public APIs.
Administration Consoles
For enterprise service endpoints, the Console of Oracle Service Bus includes configuration options for generating service level agreement notifications, pipeline notifications, messaging monitoring actions, throttling groups, and alert destinations. Environmental values may be modified independently or in bulk using the console.
Auditing Capabilities
For auditing and tracking systems, Service Bus has the following features:
- Stats on message invocations, bugs, performance metrics, SLA breaches, and passed messages are gathered.
- Allows connectivity with the solutions of third-party ESM by sending SLA-based warnings as SNMP traps.
- For business auditing, and system operations, logs select chunks of messages.
- Extracts important information from a message and uses it as a reference index for searching.
The Oracle Service Bus Monitoring Framework: An Overview
The Service Bus management system keeps track of servers, operating resources, and service level agreements (SLAs). The monitoring framework architecture is depicted below.
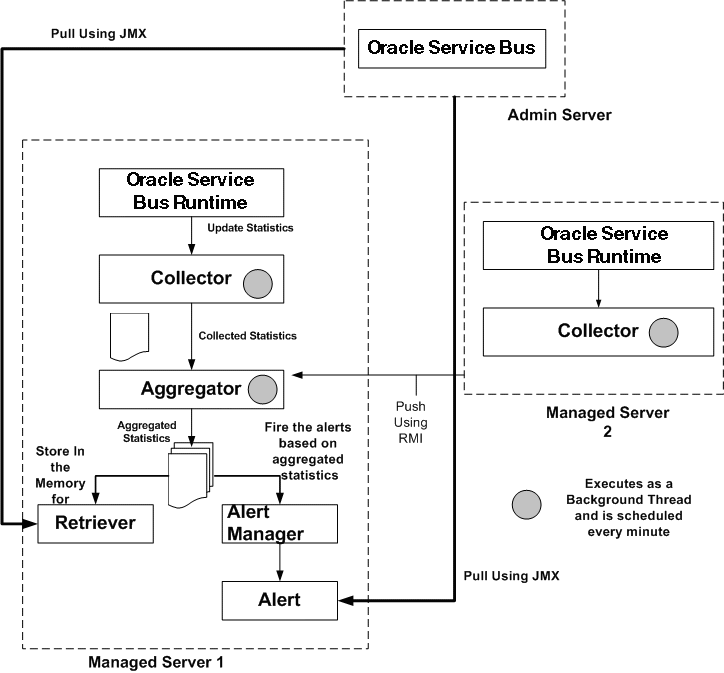
Oracle Service Bus Monitoring Framework
The following components make up the Service Bus monitoring architecture:
1. Collector
A Collector is installed on a cluster’s Managed Servers. The Collector gathers operating resource statistics at frequent time cycles and stores them in an object of RMI. During the aggregation interval, it also saves the history of the accumulated statistics.
2. Aggregator
Just one Managed Server contains the Aggregator. When you create a domain with the wizard of configuration, the server on which this is stored is chosen at random. It collects data from a cluster of all Managed Servers and aggregates it.
3. Retriever
The statistics are obtained by using the Retriever that have been saved in memory. Only the Managed Server, which comprises the aggregator, has this configuration.
4. Alert Manager
Depending on the consolidated statistics, the alert manager sends out notifications. Only the Managed Server, which includes the aggregator, has this.
Utilizing JMX API to access Statistics
Fusion Middleware Control or the Java Management Extensions (JMX) tracking APIs may be used to view statistical information for a service. The JMX monitoring APIs only have access to the running count statistics. Lower-level assistance for bulk operations is provided by the JMX monitoring APIs.
Accessing Cluster Statistics
Both statistics obtained on Managed Servers are moved to the aggregator in a clustered environment. Statistics for Managed Servers that are individual and clusters are also available. You may display statistics for the cluster or an individual Managed Server by selecting Cluster or the Managed Server name from the list of Server on the Service Health page.
Runtime Monitoring
By aggregating runtime statistics, Service Bus allows you to track and gather information of runtime used for system operations.
Administrators will see the data in real-time and keep an eye on the system’s health and identify any issues with messaging systems. This allows for quick isolation and evaluation of issues when they arise. You may also set up pipeline alerts, service level agreement (SLA) alerts, and message logging to send alerts or incident logs when those conditions are met. Fusion Middleware Control includes logger and log level setup software, and also the potential to access log entries straight from the terminal. The functionality of Service Bus monitoring is described in the sections below.
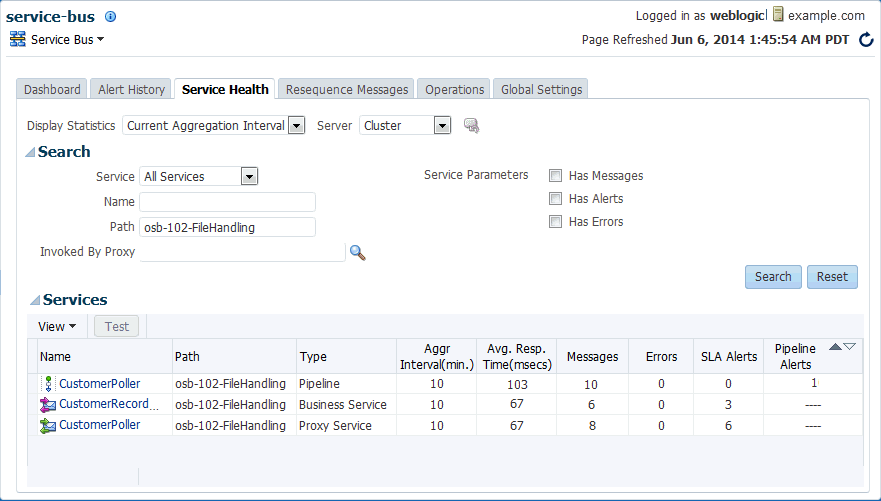
Monitoring the Health of the Service
At the project, server, and level of individual service, information about system operational health can be accessed. For all Service Bus services, statistics are accumulated. The following kinds of statistics are supported by the control system:
Counter: The errors generated, number of messages received, and failovers are all counted by a counter in the runtime. This is an integral approach that takes scalar values.
Interval: The time between two well-defined occurrences is kept track of by an interval. In the runtime, this keeps track of the average, total, maximum, and minimum number of such events. This can be applied to both non-integral and integral values.
Status Type: The status of a service is tracked using a status statistic. You may use this to monitor the object’s initial and current state.
Monitoring of SLAs and Pipeline Alerts
Alerts such as service level agreements (SLAs) and pipeline alerts are set up for individual networks and provide insight into how communications are delivered by means of such services. The following are some of the most common uses for SLA alerts:
- Monitoring WS-Security errors and sending e-mail notifications.
- The volume of messages flowing into a certain pipeline is being monitored.
- Detecting third-party items that violate service level agreements.
- Detecting an endpoint that isn’t responding.
An alert action in a pipeline is used to define pipeline alerts. Pipeline alerts are typically used to track message flow errors or to indicate a business occurrence.
Runtime Management
You’ll be able to manage Service Bus services while still monitoring them in real-time. Control operations comprises configuring operating systems, customizing environment values, endpoint URIs for enterprise applications management, and exporting and importing services. The sections below explain the tasks of management that Fusion Middleware Control can perform.
Environment Customization
When you switch the configuration from one domain to another, environment variables and values are used by Service Bus to reflect properties in the configuration that are prone to change. You can update details such as port numbers, server names, directory names, and retry settings without wanting to change each Service Bus property’s value separately by describing these properties as environment values.
Runtime Configuration
Operational settings in Fusion Middleware Control allow you control over a service’s status and how it can be handled. Configure operating settings to enable or disable the following functionality at the service or global level. At the service level, global configurations take priority over operating settings.
- The state of a service
- Logging, monitoring, and reporting
- Interval of aggregation
- Pipeline alerts and SLA
- Message tracing and execution
- Endpoints that aren’t responding
- Throttling
- caching of results
- Processing of the resequencer
Endpoint Management for Business Services
You should check endpoint URI metrics for each business operation in the runtime and make sure they’re all working properly. When you find a problem with an endpoint URI, you should mark it as offline in Service Bus to refrain from making repetitive attempts to reach it. You may also set the business service to mark URIs that aren’t responding as offline automatically.
Tuning Performance with Endpoint Throttling
Service Bus gives you power over the load imposed on a business service by allowing you to manage the flow of messages to a company service or a collection of business services. Throttling on high-traffic business networks improves efficiency and reliability by avoiding message overload. Customer service If a business service has processed the highest number of synchronized messages permitted, messages are placed in a throttling queue.
Resources Imports and Exports
You can exchange and upgrade resources and projects among various runtime environments using Service Bus’ import and export functionality. You can export and import complete JAR files of setup or only a subset of the tools in a JAR file using Fusion Middleware Control.
Diagnostics
To support you detect, diagnose, and fix problems in the runtime, Service Bus uses diagnostic and monitoring resources from Oracle Fusion Middleware and Oracle WebLogic Server. WebLogic Diagnostic Framework (WLDF) collects diagnostic data, monitors records, and sends alerts when those requirements are reached. Critical flaws, like those triggered by code glitches, data manipulation, deadlocked threads, and conflicting states, are targeted by the Oracle Fusion Middleware Diagnostic Framework.
Runtime Security
Policy usage, monitoring policies, and policy breaches for services are all part of the security administration in the runtime.
You can specify administrative protection for service clients and Service Bus users in Fusion Middleware Control by specifying authentication and authorization.
Using Security Policies
Service Bus monitors and manages the security policies associated with proxy applications and running business using common Fusion Middleware Control features. Policies serve as a foundation for managing and securing such programs. The following functions are used in management and policy monitoring:
- Policies may be attached to services and detached from them.
- Policy overrides ought to be updated.
- Globally affix policy sets.
- The use of policies has been monitored.
- Policy breaches are being monitored.
Both the Console of Oracle Service Bus and the control of Fusion Middleware enable you to customize policies for individual services.
Elucidating Security Administration
Oracle Application Development Framework (ADF) protection, which is based on Oracle Platform Security Services, is used by Service Bus for authentication and authorization (OPSS). Service Bus makes use of Fusion Middleware Control’s security features to build roles, users, and groups, and also grant security permissions. You can allocate a common set of access permissions to Service Bus functions, such as generating new resources, deploying resources, controlling the runtime, and so on, by assigning default program roles to the users you build. Both inbound transport and message-level protection use Service Bus group, user, and role data to authenticate inbound client requests depending on the circumstances.
Server Monitoring and Management
Fusion Middleware Control shows you details about the status of the Service Bus server, allowing you to keep track of the health and efficiency of your Service Bus environment and deployed applications.
Domains, clusters, management, and maintaining servers, device modules, and programs are all shown in the terminal. Fusion Middleware Control also allows you to start and stop the server.
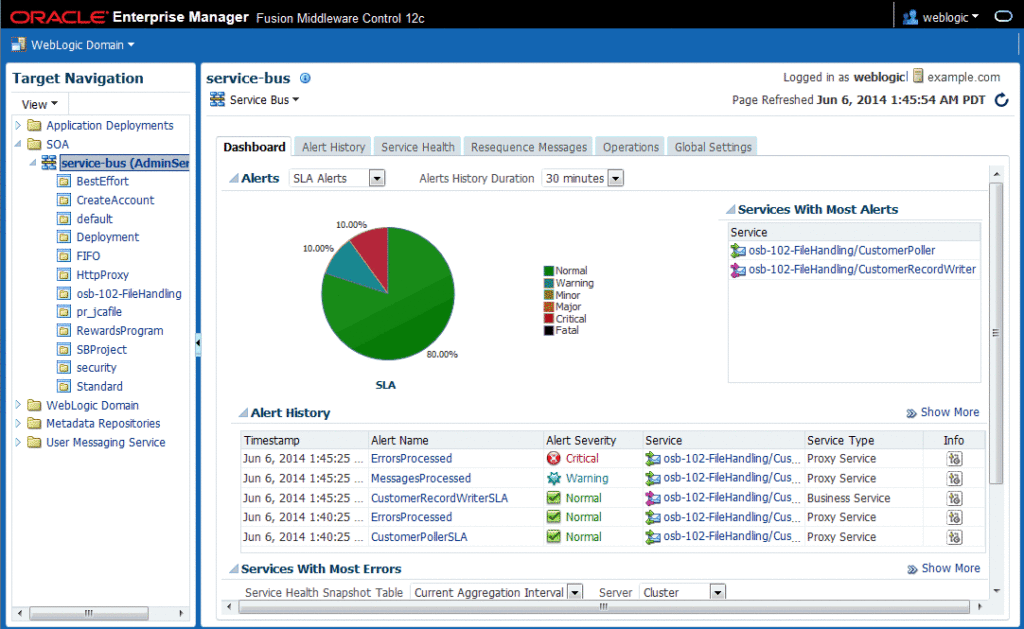
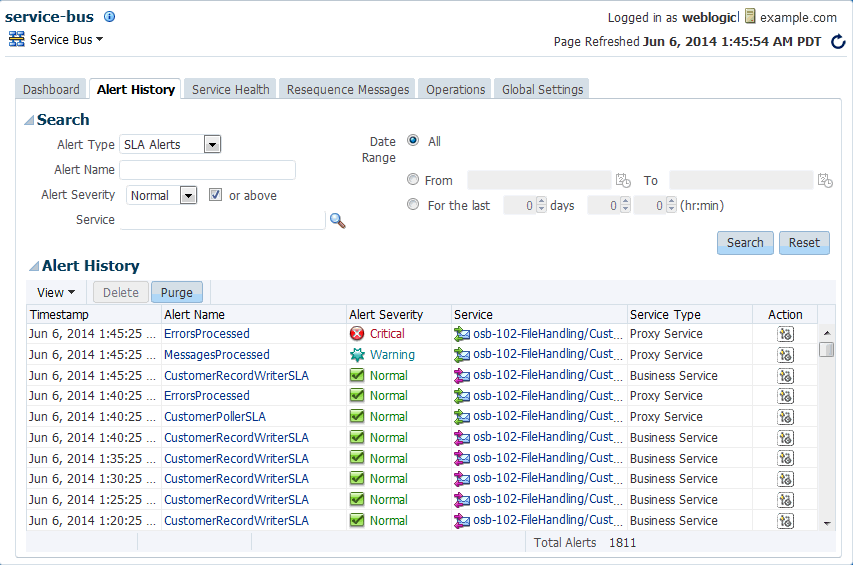
Tracking pipeline and SLA alerts, monitoring the health of individual services, showing faults for resequenced messages, and updating global and operating configurations are all possible from the Service Bus home screen.
The Service Bus Dashboard is depicted in the picture below.
The Alert History page is depicted in the diagram below.
The domain-level Service Health page is depicted in the diagram below.
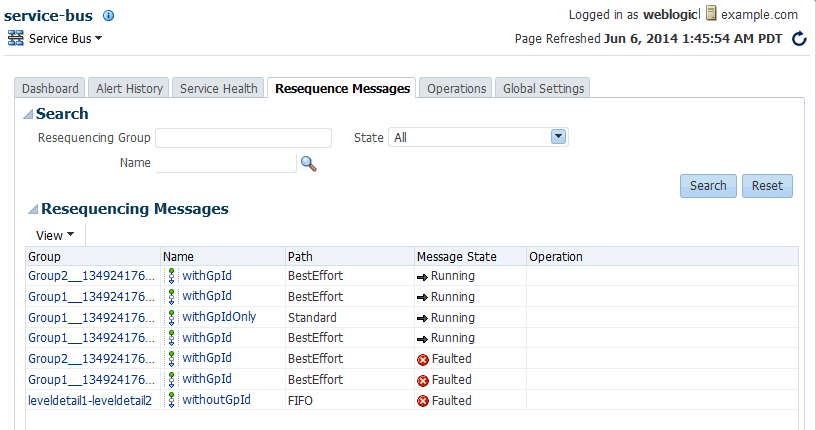
The Resequence Messages page is depicted in the diagram below.
Conclusion
You have now got familiarized with the Oracle Service Bus Administration concepts like Service monitoring and management, Administration consoles, auditing capabilities, service health monitoring, SLA and Pipeline alert monitoring, runtime management and configuration, run time security and policies, server monitoring and management.


