

Introduction
Exploratory data analysis (EDA) is a systematic method that uses visual techniques to analyse data. Using statistical summaries and graphical representations, it identifies trends and patterns or tests hypotheses.
EDA helps better understand the variables in the data collection and their relationships. It is usually used to investigate what data might disclose beyond the formal modelling or hypothesis testing assignment. It can also assist you in determining the suitability of the statistical methods you’re considering for data analysis.
Data scientists utilizes exploratory data analysis (EDA), while offering efficient machine learning development services and data science services, which frequently use data visualisation techniques, to examine and analyse data sets and summarise their key properties.
Importance of Exploratory Data Analysis
So now we are going to discuss the importance of exploratory data analysis:
- Because it offers many opportunities to make critical business decisions by evaluating massive amounts of obtained data, the topic of data science is currently crucial in the corporate world. For complete comprehension, the data must be investigated from all possible perspectives. The influencing features enable generating meaningful and beneficial decisions, making EDA a crucial part of data science.
- Data modelling is made simpler by EDA’s ability to understand a dataset’s structure easily. EDA’s main objective is to make data “clean,” which implies that it should be free of redundancies. It makes it easier to spot false data points so that they may be quickly eliminated, and the data cleaned. Also, it helps us understand the connection between the variables, giving us a wider perspective of the data and enabling us to build on it by utilising the association between the variables. It also helps in the analysis of the statistical measurements in the dataset.
- The precision of machine learning models can be impacted by outliers or other unusual occurrences in a dataset. There may also be some duplicate or missing values in the dataset. EDA can also be applied to remove or resolve all the non-desirable qualities of datasets.
Step-by-Step Process Involved in Exploratory Data Analytics
- Collection of Data
Data gathering while offering machine learning development services is crucial in exploratory data analysis. It describes the method used to locate and load data into our system. You can purchase trustworthy information from private companies or find it on various public websites. Websites like Kaggle, Github, the Machine Learning Repository, etc., are dependable sources for data acquisition.
- Discovering every variable and comprehending it
When the analysis begins, the accessible data that provides a wealth of information is the primary focus. This information includes shifting values for numerous attributes or characteristics, making comprehending and gaining insightful knowledge easier. Before doing so, one must determine the crucial factors influencing the result and their potential effects. The outcome that can be expected from any analysis depends on this stage.
- Dataset cleaning
The data set has to be cleaned because it can contain null values and unnecessary information. To ensure that the data includes only those values that are pertinent and significant from the target point of view, these must be deleted. This will reduce time and computational power from an estimating standpoint. All problems, including finding null values, outliers, anomaly identification, etc., are handled during pre-processing.
Data cleaning is the process of eliminating erroneous variables and values from your dataset as well as other imperfections. Such abnormalities may unreasonably distort the data, which will hurt the outcomes. To clean data, the following actions can be taken:
- Elevating missing values, outliers, and incorrect rows and columns.
- Reformatting and re-indexing our data.
- Determine Correlated Variables
Knowing how one variable relates to another can be determined by finding a correlation between the variables by providing a clear image of how various variables link: the correlation matrix approach aids in identifying the key connections between them.
- Picking the Correct Statistical Techniques
As you’ll see in the following sections, several statistical methods are used depending on the data, whether categorical or numerical, size, kind, and goal of the research. Although graphical images are more appealing and simpler to understand than statistical formulas applied to numerical outputs, they provide adequate information.
- Viewing and Interpreting Results
After the analysis, the results must be thoroughly scrutinised for the right interpretation. The data parameters can be modified using information from data distribution trends and variables’ correlations. Machine learning development company ensures that the data is interpreted in a correct manner so that the desired outcomes and objectives can be achieved successfully.
The data analyst should be proficient in all analysis methods and possess the necessary analytical skills. The outcomes will be pertinent to the information in that specific domain and appropriate for usage in agriculture, healthcare, and Retail.
Example To Narrate EDA in Python
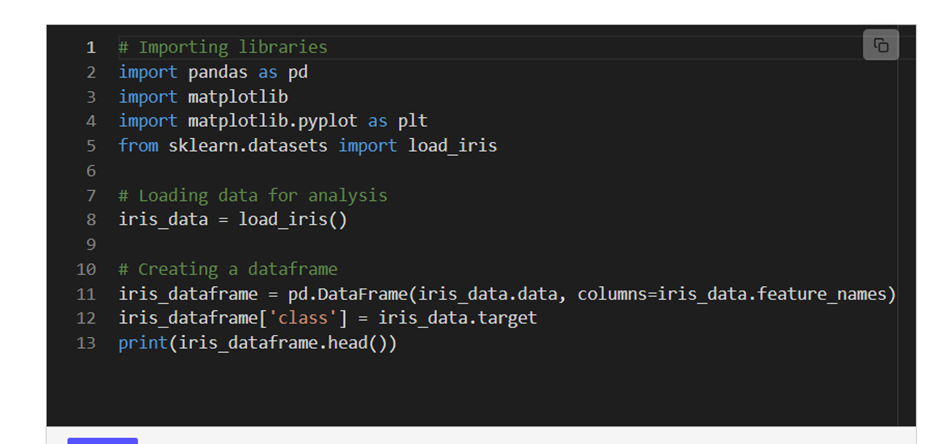
Using the iris fisher dataset, the following code blocks demonstrate EDA tasks during machine learning development services.
The created dataset has 150 records with the following five attributes: class, sepal length (cm), sepal width (cm), and petal length (cm) (represents the flower species).
Advantages of Applying Exploratory data Analysis in Machine Learning
- To better comprehend the variables, averages, means, minimum, and maximum values are extracted.
- Find the data’s outliers, missing numbers, and mistakes.
- Finding patterns by visualising the data through box plots, scatter plots, and histograms.
Particular Use Cases that take Advantages of EDA
- EDA in Health Care Research, as One Example
Let’s use Python to undertake exploratory data analysis on a dataset related to healthcare. The stroke Prediction Dataset from Kaggle is the dataset utilised in this example. We begin by importing all the libraries required to carry out EDA.
- EDA in Retail, as another example
EDA can be applied to datasets in the retail sector that include several columns, such as product categories, sales, price, discounts, region of sales, orders, etc., to analyse sales patterns better, manage inventories, forecast future demand, etc. You can practise EDA for a Superstore Sales Dataset available on Kaggle by following the procedures stated in the previous example.
- EDA in electronic medical records is an important example to demonstrate application.
Keeping electronic medical records is a crucial component for firms in the healthcare industry. These are digitised records of the patient’s medical histories, including previous hospitalisations, drugs taken, allergies, vaccines, etc. From 1999 to 2008, you can examine the UCI repository Diabetes 130-US hospitals. Data set for performing EDA like that shown in the preceding example.
Conclusion
EDA provides the context necessary to create an appropriate model for the problem and correctly interpret its results, making it a crucial step before delving into machine learning or statistical modelling. To make sure that the outcomes they produce are reliable, accurately interpreted, and applicable to the desired business contexts, data scientists can benefit from using EDA.
If you are opting to choose the best machine learning development services and data science services, then it’s time to consult the resourceful team at Hexaview Technologies, for advance & efficient solutions.